5 Queue Analytics Metrics That Reveal Bottlenecks (and How to Track Them)
Most queues don't fail loudly. They get slower a few seconds at a time, and by the time customers complain, the cause sits three steps upstream from where anyone is looking. The fix starts with numbers you can collect yourself, no analytics team required. Five metrics will show you where the friction lives, and each one takes less effort to track than most managers expect.
Service Time: The Number That Sets Your Ceiling
Service time is how long one customer occupies the resource they came for: a teller window, a phone line, a fitting room, a support agent. Measure it from the moment service starts to the moment it ends.
Average service time = total service time ÷ customers served
That average caps your throughput. If a checkout takes four minutes, one till serves roughly fifteen customers an hour, no matter how well you manage the line. Then look at the spread. A ten-minute average built from nine two-minute transactions and one eighty-minute exception behaves nothing like a steady ten-minute average. The outliers create the backup; the average merely hides them.
Track it by recording two timestamps per interaction: service start and service end. Ticket dispensers, point-of-sale logs and helpdesk tools usually capture both already. Segment by transaction type before you draw conclusions. A queue that mixes a thirty-second return with a ten-minute new account will look erratic until you split the two.
Arrival Rate Against Service Rate
Arrival rate is how many customers show up per hour. Service rate is how many you can process per hour with the staff on hand. Divide one by the other and you have utilization.
Utilization = arrival rate ÷ service rate
As utilization climbs toward its theoretical maximum, waits don't rise gradually, they accelerate. A team running at 85% has slack to absorb a slow transaction. A team running at 98% has none, and one hiccup becomes a visible line. This is why adding a single person during a genuine peak often does more than adding half a person all day.
Track arrivals hour by hour for one week. Patterns surface quickly: a Tuesday lunch spike, a Monday-morning call surge, a Friday afternoon rush before a weekend closure. Staff to the shape of the day, not the daily total.
Queue Length, and Which Way It's Moving
Queue length is the count of people waiting, excluding anyone currently being served. A single snapshot tells you little; the trend tells you everything. Eight people and shrinking is a queue doing its job. Four people and doubling every ten minutes is a queue about to break.
Queue length also connects to waiting through Little's Law: average number waiting = arrival rate × average wait. If twelve people arrive per hour and each waits ten minutes on average, two people are waiting at any given moment. When your measured number is consistently higher than the formula predicts, something is stalling: a handoff, a system lookup, a resource nobody is watching.
Track it with a count every fifteen minutes, taken at the same spot and always excluding those mid-service. Note the time, the count and who was on shift. One week of that is enough to expose the peak.
Wait Time and Service Level
Wait time is service start time minus arrival time. Measure it for everyone, including customers who left before being served; you have their arrival time even when there's no start time to pair with it.
Averages mislead here. Suppose fifty customers pass through, forty-five wait three minutes and five wait forty minutes. The average lands near seven minutes, which reads as fine on a dashboard and feels unacceptable to the five. Use a service level instead: the share of customers served inside a target.
Service level = customers served within target ÷ total customers × 100
"We aim to serve 80% of walk-ins within ten minutes" is a statement a team can act on. Report the median and the 90th percentile next to it, because the slowest tenth is where customers decide whether to come back. Then look at service level by hour. A number that only collapses at 4 p.m. is a scheduling problem, not a service problem.
Abandonment Rate
Abandonment rate = customers who left before service ÷ (served + abandoned) × 100
This is the most honest metric you have, because nobody walks out of a queue that's moving. Watch the timing as well as the rate. Abandonment often spikes just before people would have been served, which means the final few minutes of waiting cost you the customer entirely.
There's a trap worth naming. When abandonment rises, queue length falls, so the line looks healthier while the outcome gets worse. Anyone managing by queue length alone will read that as progress. Track abandonment as its own number, and count balked customers, the ones who saw the line and never took a ticket, if you can capture them at all.
How to Track All Five Without Extra Headcount
None of this requires new software. It requires consistency.
- Capture four timestamps: arrival, service start, service end, and either departure or abandon. Everything above is arithmetic once those exist.
- Use what's already there. Ticket dispensers, receipts, call logs and booking systems time-stamp most of it. A tablet at the door works when nothing else does.
- Sample deliberately. One clean week of data, reviewed hourly, beats a year of noise nobody reads.
- Report percentiles, not just averages. The 90th percentile is the experience your unhappiest customers remember.
- Review on a fixed rhythm. Ten minutes every Monday, the same numbers, dated. Trends appear faster than you'd think.
- Annotate everything. Note holidays, staffing changes, a broken kiosk. A spike without context is a mystery you'll have to solve twice.
A One-Week Data Routine
Pick a Monday. Count arrivals and queue length every fifteen minutes through your busiest four hours. Log service start and end for each transaction, and mark anyone who leaves. By Friday you'll have a baseline for all five metrics and a short list of hours that don't work.
Pick One Bottleneck and Prove It Moved
Start with two metrics. Service time and abandonment rate cover most situations, since one shows what limits you and the other shows what it costs. Establish a baseline for a week, change one thing, then measure again the same way. If service time drops but abandonment doesn't, you improved something customers weren't waiting on. Numbers only earn their keep when they end in a decision.
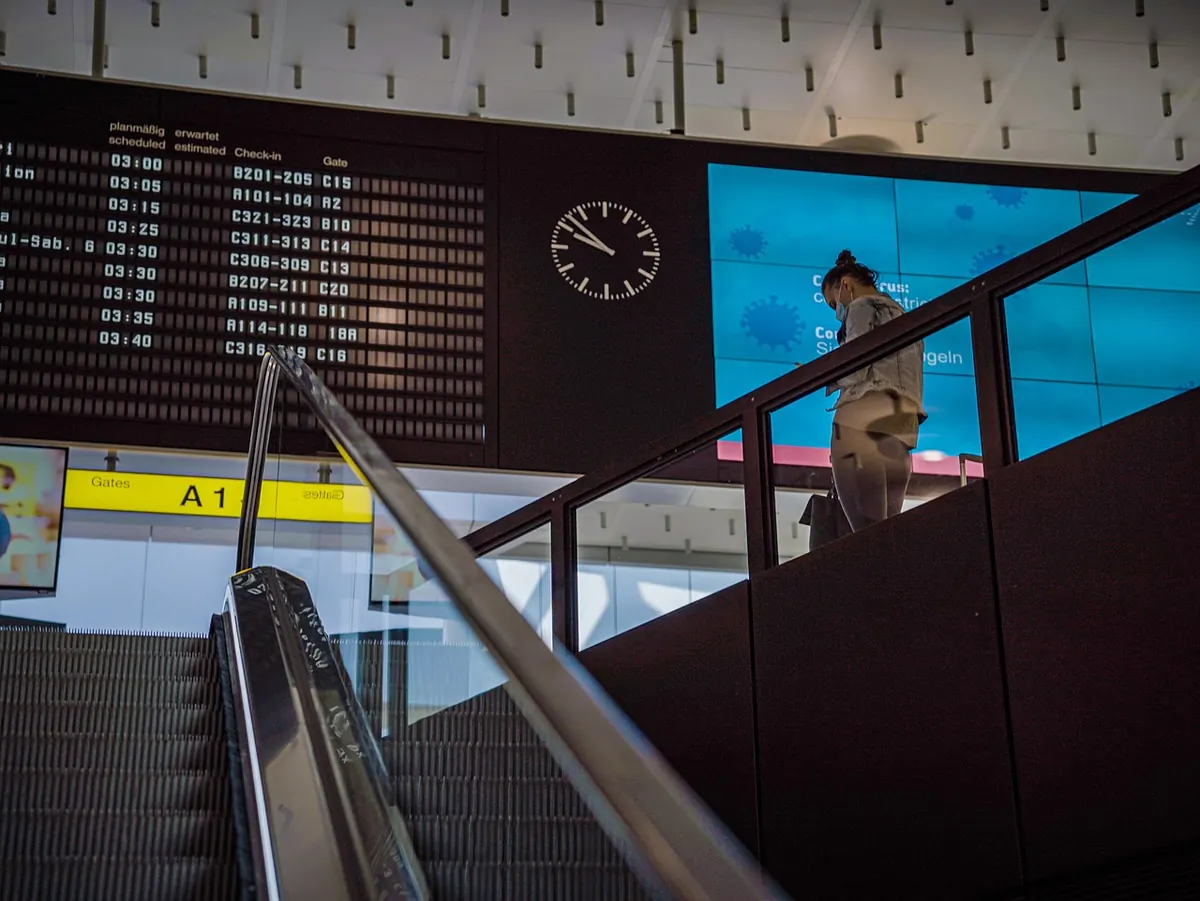
Photo: Lukas Blazek / Pexels


You Might Also Like
Copying last week's rota is easy, and expensive. Here's how to forecast queue demand interval by interval, then match shift starts, breaks, and tasks to the curve.
Turn wait-time and arrival data into a clear, one-page business case for extra staff at peak hours, with numbers your manager can check.